Economic Environment
This page gathers the Economic Environment section of Dr. Tinsley’s Smallholder Agriculture site in one place. Each topic opens with a short introduction; the full discussion is in the Read More panel beneath it. Use the list below to jump to a topic.
- Financially Suppressed Economy – Impact on Development
- Consumer Prices Comparison: USA vs. Host Country – 30% discount on prices, but 85% reduction in wages
- Financially Stalled Governments – What can they be asked to do?
- Variety Improvement – Deferred to IARCs
- Informal Income: Seed & Fertilizer Voucher Program
Financially Suppressed Economy

Most smallholder farmers in developing countries operated in what might best be described as low-income or financially-suppressed economies. This is easily understood by noting the typical expatriate advisors’ monthly salary will equal their host annual salary, as shown in the figure. As a result, the cost of living is also low. An example is the consumer price of tomatoes in Katmandu being only 1/5th the cost in the USA which could be triple the nominal farm gate price as illustrated under Private Traders page. A more detailed example would be the comparison of consumer commodity prices between Tanzania and the US as shown in the Table. However, even with this low cost of living, income can be even more suppressed resulting in the percent of income required to meet essentials being very high and approaching 80% of income including the subsistence production of smallholders. This leaves a very limited base for discretionary purchases of simple comfort items such as oil lamps, bicycles, and an occasional cold drink. Discretionary funds also defined the maximum tax base the government has to generate the revenue it needs to provide essential civil services without relying on donor funds. In the US and other developed countries with only 15 to 20% of income required to meet food essentials the discretionary income and tax base can be as high as 80% of income. In contrast in developing countries with 80% of income going for food and essential and only 20% discretionary and taxes, the tax base is virtually non-existent as shown in the figure below.
-
Read More About Financially Suppressed Economy
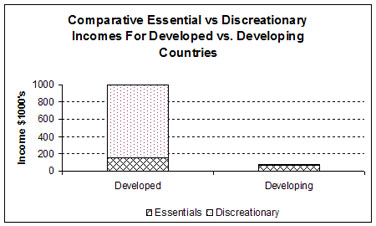 An overall financially suppressed economy has major impact on the business environment as well as the tax base for supporting public services including agriculture research and extension. Some of these impacts are:
- Very low profit margins for private sector businesses greatly reducing the degree small business such as private village based family enterprises can exploit the smallholders they serve.
- Government setting ceiling price policies for staple commodities like rice and maize in order to maintain affordable food price for the urban poor.
- Farmers responding to the reduced economic incentives by reducing their level of management for the staple crops and accepting lower yields, or shifting inputs to illicit cash crops. This can result in food insufficiency and major expenditures of foreign reserves on food imports or food aid. However, the farmers are most likely operating at the economic optimal as determined by the suppressed price policy. One unintended impact could be the suppressed ceiling price for wheat in Afghanistan encouraging poppy production. Both are winter crops.
- Heavy dependency of import and export duties to finance government, resulting in high cost of imported goods, including those essential for economic development such as fertilizer, crop protection chemicals, agriculture equipment, spare parts, and fuel.
- This can result in deferred maintenance over preventative maintenance and some very rickety, overloaded, unsafe vehicle operating on the highways, as depicted, but it may represent the economic optimal maintenance for the economic suppressed environment.
- Since taxes have to come from discretionary spending the suppressed economies result in a very low tax base for the government to provide essential civil services that often results in governments that are Financially Stalled.
Consumer Price Comparisons: USA vs. Host Country
The following tables are a comparison of consumer prices between various host countries and the the US. They are provided as a data sources as referenced in other pages of this website.
-
Afghanistan
Comparative Consumer Prices (Afghanistan vs. USA)
Commodity Afghan Price (US$) US Price (US$) Adjusted to US$ & Common Compar-ison Price Unit Price Unit Afghan US Unit Afghan/US General Flour 1.40 Sear 1.13 5 lbs 0.20 0.50 Kg 0.40 Rice 5.00 Sear 2.50 5 lbs 0.71 1.10 Kg 0.65 Salt 0.40 Sear 0.49 lbs 0.06 1.08 Kg 0.05 Veg.Oil 0.90 Sear 1.54 qt 0.13 1.45 Lit 0.09 Tea 2.00 Kg 4.99 11 oz 2.00 15.97 Kg 0.13 Dry Beans 5.00 Sear 3.00 4 lbs 0.71 1.65 Kg 0.43 Dairy Sugar 0.80 Kg 2.89 5 lbs 0.80 1.27 Kg 0.63 Eggs 0.10 each 1.03 doz 0.10 0.09 ea 1.17 Milk 0.50 Kg 1.99 0.5 gal 0.50 0.94 Kg 0.53 Butter 4.00 Kg 3.99 lbs 4.00 8.78 Kg 0.46 Yogurt 1.80 Kg 2.99 qt 1.80 2.81 Kg 0.64 Meat Beef 2.30 Kg 3.99 lbs 2.30 8.78 Kg 0.26 Chicken 1.50 Kg 1.24 lbs 1.50 2.73 Kg 0.55 Lamb 3.00 Kg 4.99 lbs 3.00 10.98 Kg 0.27 Fish 1.30 Kg 5.49 lbs 1.30 12.08 Kg 0.11 Can Fish 0.60 can 3.29 lbs 0.60 7.24 Kg 0.08 Vegetables Tomatoes 2.00 Sear 3.99 lbs 0.29 8.78 Kg 0.03 Carrots 1.00 Sear 0.59 2 lbs 0.14 0.65 Kg 0.22 Beans 5.00 Sear 1.00 lbs 0.71 2.20 Kg 0.32 Peas 3.00 Sear 3.99 lbs 0.43 8.78 Kg 0.05 Onions 2.60 Sear 1.99 3 lbs 0.37 1.46 Kg 0.25 Eggplant 2.00 sear 1.99 1.25 lbs 0.29 3.50 Kg 0.08 Potatoes 2.00 Sear 0.99 lbs 0.29 2.18 Kg 0.13 Cucumbers 1.00 Kg 0.99 lbs 1.00 2.18 Kg 0.46 Fruits Bananas 0.20 ea 0.50 lbs 1.10 Kg Apples 1.00 Kg 1.99 lbs 1.00 4.38 Kg 0.23 Grapes 1.00 Kg 2.50 lbs 1.00 5.50 Kg 0.18 Plums 0.20 Kg na 0.20 Kg Oranges 0.80 Kg 0.39 lbs 0.80 0.86 Kg 0.93 Other Gas 1.00 Lit 2.15 gal 1.00 0.57 Lit 1.76 Diesel 0.70 Lit 2.59 gal 0.70 0.69 Lit 1.02 *Sear is a local Afghan unit most likely originally a volume measure but converted to weight. 1 Sear = 7 kgs -
Bangledesh
Comparative Consumer Prices (Bangledesh vs. USA
Commodity Bangledesh Price (TK) US Price (US$) Adjusted to US$ & Common Unit Compar-ison Ratio Price Unit Price Unit BD US Unit BD/US Dry Goods Flour 42 kg 0.39 lbs 0.61 0.86 Kg 0.72 Sugar 32 kg 0.67 lbs 0.47 1.47 Kg 0.32 Salt 15 kg 0.30 lbs 0.00 0.66 Kg 0.00 Rice 45 kg 0.80 lbs 0.66 1.76 Kg 0.37 Veg.Oil 110 lit 1.53 qt 1.61 1.44 lit 1.12 Tea 200 kg 4.59 lbs 2.92 10.10 Kg 0.29 Lentils 70 kg 1.39 lbs 1.02 3.06 Kg 0.33 Mungbeans 45 kg 1.99 lbs 0.66 4.38 Kg 0.15 Peas 35 kg 0.99 lbs 0.51 2.18 Kg 0.23 Dry Beans 35 kg 1.20 lbs 0.51 2.64 Kg 0.19 Dairy Eggs 5 ea 0.16 ea 0.07 0.16 ea 0.46 Milk (UHT) 25 lit 1.99 0.5 gal 0.37 0.94 lit 0.39 Butter 270 kg 2.99 qt 3.95 2.81 lit 1.40 Meat Beef 180 kg 1.35 lbs 2.63 2.97 Kg 0.89 Chicken 95 kg 0.99 lbs 1.39 2.18 Kg 0.64 Duck 110 kg 1.69 lbs 1.61 3.72 Kg 0.43 Goat 250 kg 5.99 lbs 3.65 13.18 Kg 0.28 Fish 300 kg 2.49 lbs 4.39 5.48 Kg 0.80 Vegetables Tomatoes 25 kg 1.00 lbs 0.37 2.20 Kg 0.17 Carrots 20 kg 0.59 lbs 0.29 1.30 Kg 0.23 Beans 17 kg 2.49 lbs 0.25 5.48 Kg 0.05 Onions 35 kg 0.89 3 lbs 0.51 0.65 Kg 0.78 Potatoes 20 kg 0.99 lbs 0.29 2.18 Kg 0.13 Yam 15 kg 1.59 lbs 0.22 3.50 Kg 0.06 Kale & Collard 13 kg 2.49 lbs 0.19 5.48 Kg 0.03 Spinach 10 kg 2.49 lbs 0.15 5.48 Kg 0.03 Turnip 10 kg 1.99 lbs 0.15 4.38 Kg 0.03 Mustard 10 kg 2.49 lbs 0.15 5.48 Kg 0.03 Amarath 10 kg 2.49 lbs 0.15 5.48 Kg 0.03 Radish 10 kg 1.99 lbs 0.15 4.38 Kg 0.03 Watermellon 8 kg 1.00 lbs 0.12 2.20 Kg 0.05 Cauliflower 15 kg 1.99 lbs 0.22 4.38 kg 0.06 Broccoli 20 kg 1.99 lbs 0.29 4.38 Kg 0.07 Squash 10 kg 1.49 lbs 0.15 3.28 Kg 0.04 Cabbage 12 kg 0.59 lbs 0.18 1.30 Kg 0.14 Cucumbers 25 kg 1.00 lbs 0.37 2.20 Kg 0.17 Fruits Bananas 2 ea 0.50 lbs 0.03 1.10 Kg 0.03 Pineapples 17 ea 4.99 lbs 0.25 10.98 Kg 0.02 Papaya 20 kg 2.25 lbs 0.29 4.95 Kg 0.06 Mango 70 kg 1.50 lbs 1.02 3.30 Kg 0.31 Apple 85 kg 1.79 lbs 1.24 3.94 kg 0.32 Grapes 90 kg 1.00 lbs 1.32 2.20 Kg 0.60 Spices Garlic 45 kg 4.14 lbs 0.66 9.11 Kg 0.07 Ginger 45 kg 3.99 lbs 0.66 8.78 Kg 0.07 Dried Chili 200 kg 23.92 lbs 2.92 52.62 Kg 0.06 Green Chili 35 kg 1.59 lbs 0.51 3.50 Kg 0.15 Other Gas 70 lit 2.89 gal 1.02 0.76 lit 1.34 Diesel 46 lit 3.39 gal 0.67 0.90 lit 0.75 Exchange rate US$ = 68.4 Taka -
Indonesia
Comparative Consumer Prices (Indonesia vs. USA)
Commodity Indonesia Price US Price Adjusted to US$ & Common Unit Compar-ison Ratio Price Unit Price Unit Indonesia US Unit Indo/US Dry Goods Flour 11,000 kg 1.13 5 lbs 1.10 0.50 Kg 2.21 Sugar 8,000 kg 2.89 5 lbs 0.80 1.27 Kg 0.63 Salt 2,500 100 g 0.49 lbs 2.50 1.08 Kg 2.32 Rice 5,000 kg 2.50 5 lbs 0.50 1.10 Kg 0.45 Veg.Oil 12,000 lit 1.54 qt 1.20 1.45 lit 0.83 Coffee 18,000 kg 9.98 lbs 1.80 21.96 Kg 0.08 Dry Beans 8,000 kg 0.54 lbs 0.80 1.19 Kg 0.67 Dairy Eggs 12,000 dozen 1.03 doz 0.10 0.09 ea 1.17 Milk (UHT) 11,000 liter 1.99 0.5 gal 1.10 0.94 lit 1.18 Meat Beef 6,500 kg 3.99 lbs 0.65 8.78 Kg 0.07 Chicken 25,000 whole 1.24 lbs 1.25 2.73 Kg 0.46 Duck 30,000 whole 1.69 lbs 1.50 3.72 Kg 0.40 Fish 35,000 kg 5.49 lbs 3.50 12.08 Kg 0.29 Vegetables Tomatoes 5,000 kg 3.99 lbs 0.50 8.78 Kg 0.06 Carrots 8,000 kg 0.59 2 lbs 0.80 0.65 Kg 1.23 Beans 10,000 kg 1.00 lbs 1.00 2.20 Kg 0.45 Onions 12,000 kg 1.99 3 lbs 1.20 1.46 Kg 0.82 Eggplant 7,000 kg 1.99 1.25 lbs 0.70 3.50 Kg 0.20 Potatoes 15,000 kg 0.99 lbs 1.50 2.18 Kg 0.69 Sweet Potatoes 12,000 kg 1.49 lbs 1.20 3.28 Kg 0.37 Cassava 10,000 kg 0.99 lbs 1.00 2.18 Kg 0.46 Cabbage 25,000 kg 0.59 lbs 2.50 1.30 Kg 1.93 Cucumbers 8,000 kg 0.99 lbs 0.80 2.18 Kg 0.37 Fruits Bananas 15,000 1 bunch 0.50 lbs 0.75 1.10 Kg 0.68 Pineapples 10,000 kg 4.99 3.5 kg 1.00 1.43 Kg 0.70 Mango 15,000 kg 1.50 14 oz 1.50 1.31 Kg 1.14 Durian 25,000 kg 0.69 lbs 2.50 1.52 Kg 1.65 Other Gas 4,500 liter 2.15 gal 0.45 0.57 lit 0.79 Exchange rate 1 US$ = Rp 10,000 -
Iraq
Comparative Consumer Prices (Iraq vs. USA)
Commodity Iraq Price (Dinars) US Price (US$) Adjusted to US$ & Common Unit Compar-ison Ratio Price Unit Price Unit Iraq US Unit Iraq/US Dry Goods Flour (PDS) 175.00 Kg 1.13 5 lbs 0.14 0.50 Kg 0.29 Flour (UAE) 1,125.00 Kg 1.13 5 lbs 0.92 0.50 Kg 1.85 Sugar 500.00 Kg 2.89 5 lbs 0.41 1.27 Kg 0.32 Salt 500.00 0.5 Kg 0.49 lbs 0.82 1.08 Kg 0.76 Pasta 500.00 0.5 Kg 0.75 lbs 0.82 1.65 Kg 0.49 Rice 500.00 Kg 2.50 5 lbs 0.41 1.10 Kg 0.37 Veg.Oil 1,350.00 Lit 1.54 qt 1.10 1.45 lit 0.76 Coffee (Iraq) 10,000.00 Kg 9.98 lbs 8.16 21.96 Kg 0.37 Coffee (Jordan) 18,000.00 Kg 9.98 lbs 14.68 21.96 Kg 0.67 Dry Beans 1,250.00 Kg 0.54 lbs 1.02 1.19 Kg 0.86 Dairy Eggs 5,500.00 30 Tray 1.03 doz 0.15 0.09 ea 1.74 Milk (UHT) 1,300.00 Lit 1.99 0.5 gal 1.06 0.94 lit 1.13 Yogurt (Cheap) 1,500.00 Kg 2.99 qt 1.22 2.81 lit 0.44 Yogurt (Erbil) 2,500.00 Kg 2.99 qt 2.04 2.81 lit 0.73 Meat Beef 8,000.00 Kg 3.99 lbs 6.53 8.78 Kg 0.74 Chicken 4,500.00 1.3 Kg 1.24 lbs 2.82 2.73 Kg 1.03 Sheep 7,500.00 Kg 1.69 lbs 6.12 3.72 Kg 1.65 Fish (Imported) 8,000.00 Kg 5.49 lbs 6.53 12.08 Kg 0.54 Fish (Iraq) 1,500.00 Kg 5.49 lbs 1.22 12.08 Kg 0.10 Can Fish 1,200.00 300 g 3.29 lbs 1.96 7.24 Kg 0.27 Vegetables Tomatoes 625.00 Kg 3.99 lbs 0.51 8.78 Kg 0.06 Carrots 1,000.00 Kg 0.59 2 lbs 0.82 0.65 Kg 1.26 Beans 1,500.00 Kg 1.00 lbs 1.22 2.20 Kg 0.56 Peas 1,500.00 Kg 3.99 lbs 1.22 8.78 Kg 0.14 Onions 500.00 Kg 1.99 3 lbs 0.41 1.46 Kg 0.28 Eggplant 1,000.00 Kg 1.99 1.25 lbs 0.82 3.50 Kg 0.23 Potatoes 1,000.00 Kg 0.99 lbs 0.82 2.18 Kg 0.37 Cabbage 875.00 Kg 0.59 lbs 0.71 1.30 Kg 0.55 Cucumbers 1,000.00 Kg 0.99 lbs 0.82 2.18 Kg 0.37 Fruits Bananas 1,500.00 Kg 0.50 lbs 1.22 1.10 Kg 1.11 Pineapples 4,000.00 Kg 4.99 3.5 kg 3.26 1.43 Kg 2.29 Mango 1,500.00 Kg 1.50 14 oz 1.22 1.31 Kg 0.93 Other Gas (Offical) 450.00 Lit 2.15 gal 0.37 0.57 lit 0.65 Gas (Informal) 1,100.00 Lit 2.15 gal 0.90 0.57 lit 1.58 Diesel 150.00 Lit 2.59 gal 0.12 0.69 lit 0.18 Exchange rate US$ = 1,226 Iraq Dinar -
Nepal
Consumer Price Comparison (Nepal vs. USA)
Commodity Nepal Price (NRs) US Price (US$) Adjusted to US$ & Common Unit Compar-ison Price Unit Price Unit Nepal USA Unit Nepal/USA Dry Goods Flour 30.00 kg 1.13 5 lbs 0.43 0.50 kg 0.86 Sugar 50.00 kg 2.89 5 lbs 0.71 1.27 kg 0.56 Salt 24.00 kg 0.49 lbs 0.34 1.08 kg 0.32 Pasta 100.00 kg 0.75 lbs 1.43 1.65 kg 0.87 Rice 25.00 kg 2.50 5 lbs 0.36 1.10 kg 0.32 Veg.Oil 90.00 Lit 1.54 qt 1.29 1.46 Lit 0.88 Coffee 98.00 100gms 9.98 lbs 14.00 21.96 kg 0.64 Dry Beans 50.00 kg 0.54 lbs 0.71 1.19 kg 0.60 Dairy Eggs 60.00 Doz. 1.03 doz 0.86 1.03 Doz. 0.83 Milk (UHT) 12.00 Lit 1.99 0.5 gal 0.17 0.94 Lit 0.18 Yogurt 25.00 Lit 2.99 qt 0.36 2.83 Lit 0.13 Meat Beef (Buff) 100.00 kg 3.99 lbs 1.43 8.78 kg 0.16 Chicken 150.00 kg 1.24 lbs 2.14 2.73 kg 0.79 Duck 180.00 kg 1.69 lbs 2.57 3.72 kg 0.69 Pork 200.00 kg 1.34 lbs 2.86 2.95 kg 0.97 Fish 130.00 kg 5.49 lbs 1.86 12.08 kg 0.15 Can Fish 50.00 100gms 3.29 lbs 0.71 7.24 kg 0.10 Vegetables Tomatoes 30.00 kg 3.99 lbs 0.43 8.78 kg 0.05 Carrots 15.00 kg 0.59 2 lbs 0.21 0.65 kg 0.33 Beans 50.00 kg 1.00 lbs 0.71 2.20 kg 0.32 Peas 30.00 kg 3.99 lbs 0.43 8.78 kg 0.05 Onions 30.00 kg 1.99 3 lbs 0.43 1.46 kg 0.29 Eggplant 35.00 kg 1.99 1.25 lbs 0.50 3.50 kg 0.14 Potatoes 60.00 kg 0.99 lbs 0.86 2.18 kg 0.39 Sweet Potatoes 80.00 kg 1.49 lbs 1.14 3.28 kg 0.35 Cabbage 15.00 kg 0.59 lbs 0.21 1.30 kg 0.17 Cucumbers 15.00 kg 0.99 lbs 0.21 2.18 kg 0.10 Fruits Bananas 25.00 Doz. 0.50 lbs Pineapples 30.00 Doz. 4.99 3.5 lbs Mango 50.00 kg 1.50 14 oz 0.71 2.89 kg 0.25 Other Gas 62.06 Lit 2.15 gal 0.89 0.57 Lit 1.56 Diesel 57.00 Lit 2.59 gal 0.81 0.69 Lit 1.19 Exchange rate US$ = 71.080 NRs -
Pakistan
Comparative Consumer Prices (Pakistan vs. USA)
Commodity Pakistan Price (PKR) US Price Adjusted to US$ & Common Unit Compar-ison Ratio Price Unit Price Unit Pakistan US Unit Pak/US Dry Goods Flour medium super 34 kg 0.35 lbs 0.35 0.77 Kg 0.45 Sugar 54 kg 0.67 lbs 0.55 1.47 Kg 0.38 Iodized Salt 18 kg 0.60 lbs 0.18 1.32 Kg 0.14 Pasta 45 400 gm 1.48 lbs 1.16 3.26 Kg 0.36 Rice 190 kg 0.75 lbs 1.95 1.65 Kg 1.18 Maize Meal 21 kg 0.72 lbs 0.22 1.58 Kg 0.14 Veg.Oil 190 kg 0.89 qt 1.95 0.84 lit 2.33 Tea 490 kg 10.00 lbs 5.04 22.00 Kg 0.23 Coffee (Ground) 130 50 gm 3.78 lbs 26.72 8.32 Kg 3.21 Cowpeas 120 kg 1.49 lbs 1.23 3.28 Kg 0.38 Sorghum 140 kg 1.79 lbs 1.44 3.94 Kg 0.37 Sesame 80 kg 3.79 lbs 0.82 8.34 Kg 0.10 Groundnuts 160 kg 2.99 lbs 1.64 6.58 Kg 0.25 Dairy Eggs 125 dozen 2.09 doz 1.28 2.09 ea 0.61 Milk (UHT) 90 liter 2.19 gal 0.92 0.58 lit 1.60 Yogurt 80 kg 2.69 qt 0.82 2.53 lit 0.33 Meat Beef 340 kg 3.49 lbs 3.49 7.68 Kg 0.46 Chicken 173 kg 1.29 lbs 1.78 2.84 Kg 0.63 Goat/Lamb 650 kg 7.49 6.68 16.48 kg 0.41 Fish 280 kg 4.99 lbs 2.88 10.98 Kg 0.26 Vegetables Tomatoes 80 kg 1.49 lbs 0.82 3.28 Kg 0.25 Carrots 40 kg 0.99 lbs 0.41 2.18 Kg 0.19 Beans 50 kg 1.99 lbs 0.51 4.38 Kg 0.12 Peas 60 kg 4.79 lbs 0.62 10.54 Kg 0.06 Onions 30 kg 0.99 lbs 0.31 2.18 Kg 0.14 Eggplant 40 kg 2.49 lbs 0.41 5.48 Kg 0.08 Potatoes 30 kg 0.30 lbs 0.31 0.66 Kg 0.47 Sweet Potatoes 30 kg 0.99 lbs 0.31 2.18 Kg 0.14 Cabbage 40 kg 0.79 lbs 0.41 1.74 Kg 0.24 Cucumbers 60 kg 1.35 lbs 0.62 2.97 Kg 0.21 Fruits Apples 140 kg 0.99 lbs 1.44 2.18 Kg 0.66 Bananas 100 kg 0.55 lbs 1.03 1.21 Kg 0.85 Mango 70 kg 1.80 lbs 0.72 3.96 Kg 0.18 Oranges 120 kg 0.99 lbs 1.23 2.18 Kg 0.57 Other Petroleum 102 lit 2.80 gal 1.05 0.74 lit 1.42 Diesel 110 lit 3.50 gal 0.73 0.93 lit 0.79 Exchange rate US$ = 97.3 PKR Date: January 2013 Note: These above mentioned food prices are variable on daily basis due to current conflict and energy crises. -
Philippines
Comparative Consumer Prices (Philippines vs. USA)
Commodity Philippines Price (Peso) US Price (US$) Adjusted to US$ & Common Unit Compar-ison Price Unit Price Unit Phil US Unit Ph/US Dry Goods Flour 28.00 Kg 1.13 5 lbs 0.60 0.50 Kg 1.21 Sugar 37.00 Kg 2.89 5 lbs 0.79 1.27 Kg 0.62 Salt 23.50 Kg 0.49 lbs 0.50 1.08 Kg 0.47 Pasta 82.14 Kg 0.75 lbs 1.76 1.65 Kg 1.07 Rice 32.60 Kg 2.50 5 lbs 0.70 1.10 Kg 0.64 Veg.Oil 83.00 Lit 1.54 qt 1.78 1.46 Lit 1.22 Coffee 68.00 100 g 9.98 lbs 14.58 21.96 Kg 0.66 Dairy Eggs 53.00 Doz 1.03 doz 1.14 1.03 doz 1.10 Milk (UHT) 63.00 Lit 1.99 0.5 gal 1.35 0.94 Lit 1.43 Yogurt 40.00 150 g 2.99 qt 5.72 3.29 Kg 1.74 Meat Beef 160.00 Kg 3.99 lbs 3.43 8.78 Kg 0.39 Chicken 100.00 Kg 1.24 lbs 2.14 2.73 Kg 0.79 Pork 120.00 Kg 1.34 lbs 2.57 2.95 Kg 0.87 Fish 120.00 Kg 5.49 lbs 2.57 12.08 Kg 0.21 Can Fish 21.00 200 g 3.29 lbs 2.25 7.24 Kg 0.31 Vegetables Tomatoes 48.00 Kg 3.99 lbs 1.03 8.78 Kg 0.12 Carrots 66.00 Kg 0.59 2 lbs 1.41 0.65 Kg 2.18 Beans 50.00 Kg 1.00 lbs 1.07 2.20 Kg 0.49 Peas 180.00 Kg 3.99 lbs 3.86 8.78 Kg 0.44 Onions 36.00 Kg 1.99 3 lbs 0.77 1.46 Kg 0.53 Eggplant 25.00 Kg 1.99 1.25 lbs 0.54 3.50 Kg 0.15 Potatoes 41.00 Kg 0.99 lbs 0.88 2.18 Kg 0.40 Sweet Potatoes 40.00 Kg 1.49 lbs 0.86 3.28 Kg 0.26 Cabbage 30.00 Kg 0.59 lbs 0.64 1.30 Kg 0.50 Cucumbers 48.00 Kg 0.99 lbs 1.03 2.18 Kg 0.47 Fruits Bananas 32.00 Kg 0.50 lbs 0.69 1.10 Kg 0.62 Pineapples 120.00 Kg 4.99 3.5 kg 2.57 3.14 Kg 0.82 Mango 50.00 Kg 1.50 14 oz 1.07 2.89 Kg 0.37 Other Gas 40.70 Lit 2.15 gal 0.87 0.57 Lit 1.53 Diesel 35.65 Lit 2.59 gal 0.76 0.69 Lit 1.12 Exchange rate US$ = 46.65 Pesos -
Thailand
Comparative Consumer Prices (Thailand vs. USA)
Commodity Thailand Price (Bakh) US Price Adjusted to US$ & Common Unit Compar-ison Ratio Price Unit Price Unit Thai US Unit Thai/US Dry Goods Flour 62 kg 0.33 lbs 1.82 0.73 Kg 2.51 Sugar 40 kg 0.5 lbs 1.18 1.1 Kg 1.07 Salt 10 kg 0.49 lbs 0.29 1.08 Kg 0.27 Pasta 150 kg 0.74 lbs 4.41 1.63 Kg 2.71 Rice 30 kg 0.75 lbs 0.88 1.65 Kg 0.53 Veg.Oil 46 lit 1.54 qt 1.35 1.45 lit 0.93 Dry Beans 60 kg 1.72 lbs 1.76 3.78 Kg 0.47 Dairy Eggs 3 ea 0.11 ea 0.09 0.11 ea 0.82 Milk (UHT) 150 lit 2.19 gal 4.41 0.58 lit 7.61 Yogurt 100 lit 2.99 qt 2.94 2.81 lit 1.05 Meat Beef 130 kg 3.99 lbs 3.82 8.78 Kg 0.44 Chicken 80 kg 1.59 lbs 2.35 3.5 Kg 0.67 Duck 120 kg 3.98 lbs 3.53 8.76 Kg 0.4 Pork 120 kg 1.39 lbs 3.53 3.06 Kg 1.15 Fish 100 kg 5.49 lbs 2.94 12.08 Kg 0.24 Canned Fish 100 kg 3.29 lbs 2.94 7.24 Kg 0.41 Vegetables Tomatoes 19 kg 3.99 lbs 0.56 8.78 Kg 0.06 Carrots 19 kg 0.6 lbs 0.56 1.32 Kg 0.42 Peas 19 kg 3.99 lbs 0.56 8.78 Kg 0.06 Onions 26 kg 0.82 lbs 0.76 1.8 Kg 0.42 Eggplant 18 kg 1.59 lbs 0.53 3.5 Kg 0.15 Potatoes 30 kg 0.25 lbs 0.88 0.55 Kg 1.6 Cabbage 19 kg 0.59 lbs 0.56 1.3 Kg 0.43 Cucumbers 15 kg 0.99 lbs 0.44 2.18 Kg 0.2 Fruits Bananas 8 kg 0.39 lbs 0.24 0.86 Kg 0.27 Pineapples 24 kg 1.14 lbs 0.71 0.52 Kg 1.36 Mango 30 kg 1.71 lbs 0.88 3.77 Kg 0.23 Papaya 40 kg 1.49 lbs 1.18 0.68 Kg 1.74 Other Gas 30 lit 2.15 gal 0.88 0.57 lit 1.55 Diesel 26 lit 2.59 gal 0.76 0.69 lit 1.12 Exchange rate US$ = Baht 34.03 Date: November 2009 -
Viet Nam
Comparative Consumer Prices (Viet Nam vs. USA)
Commodity Viet Nam Price (Dong) US Price (US$) Adjusted to US$ & Common Unit Comparison Ratio Price Unit Price Unit VN US Unit VN/US Dry Goods Flour 15,000 kg 1.13 5 lbs 0.94 0.5 Kg 1.88 Sugar 11,000 kg 2.89 5 lbs 0.69 1.27 Kg 0.54 Salt 2,000 kg 0.49 lbs 0.12 1.08 Kg 0.12 Rice 6,800 kg 2.5 5 lbs 0.42 1.1 Kg 0.39 Veg.Oil 17,000 lit 1.54 qt 1.06 1.45 lit 0.73 Coffee 25,000 kg 9.98 lbs 1.56 21.96 Kg 0.07 Mung Beans 9,000 kg 0.54 lbs 0.56 1.19 Kg 0.47 Dairy Eggs 12,000 10 eggs 1.03 doz 0.07 0.09 ea 0.87 Milk (UHT) 15,000 lit 1.99 0.5 gal 0.94 0.94 lit 1 Yogurt 30,000 lit 2.99 qt 1.87 2.81 lit 0.67 Meat Beef 85,000 kg 3.99 lbs 5.3 8.78 Kg 0.6 Chicken 25,000 kg 1.24 lbs 1.56 2.73 Kg 0.57 Duck 20,000 kg 1.69 lbs 1.25 3.72 Kg 0.34 Pork 32,000 kg 1.34 lbs 2 2.95 Kg 0.68 Fish 25,000 kg 5.49 lbs 1.56 12.08 Kg 0.13 Can Fish 4,000 1 can 3.29 lbs 0.22 7.24 Kg 0.03 Vegetables Tomatoes 5,000 kg 3.99 lbs 0.31 8.78 Kg 0.04 Carrots 5,000 kg 0.59 2 lbs 0.31 0.65 Kg 0.48 Beans 4,000 kg 1 lbs 0.25 2.2 Kg 0.11 Peas 25,000 kg 3.99 lbs 1.56 8.78 Kg 0.18 Onions 5,000 kg 1.99 3 lbs 0.31 1.46 Kg 0.21 Eggplant 4,000 kg 1.99 1.25 lbs 0.25 3.5 Kg 0.07 Potatoes 8,000 kg 0.99 lbs 0.5 2.18 Kg 0.23 Sweet Potatoes 6,000 kg 1.49 lbs 0.37 3.28 Kg 0.11 Cassava 4,000 kg 0.99 lbs 0.25 2.18 Kg 0.11 Cabbage 3,000 kg 0.59 lbs 0.19 1.3 Kg 0.14 Cucumbers 4,000 kg 0.99 lbs 0.25 2.18 Kg 0.11 Fruits Bananas 2,000 kg 0.5 lbs 0.12 1.1 Kg 0.11 Pineapples 1,500 kg 4.99 3.5 kg 0.09 1.43 Kg 0.07 Mango 7,000 kg 1.5 14 oz 0.44 1.31 Kg 0.33 Duran 10,000 kg 0.69 lbs 0.62 1.52 Kg 0.41 Other Gas 174,000 12 kg 2.15 gal 1.44 0.57 lit 2.54 Diesel 10,500 lit 2.59 gal 0.65 0.69 lit 0.96 Exchange rate US$ = 16,032 VN Dong 1/27/2007 -
Angola
Comparative Consumer Prices (Angola vs. USA) Commodity Angola Price (Kwanzas) US Price Adjusted to US$ & Common Unit Compar-ison Ratio Price Unit Price Unit Angola US Unit An/US Condiments Salt 200 kg 0.99 lbs 1.21 2.18 kg 0.56 Pepper 50 kg 20.96 lbs 0.30 46.11 kg 0.01 Coffee 1200 kg 6.67 lbs 7.27 14.67 kg 0.50 Tea 1000 kg 6.857 lbs 6.06 15.09 kg 0.40 Sugar 250 kg 0.47 lbs 1.52 1.04 kg 1.46 Garlic 50 ea 0.50 ea 0.30 1.10 ea 0.28 Ginger 15 ea 3.99 lbs 0.83 8.78 kg 0.09 Dry Goods Pasta 100 kg 1.44 lbs 0.61 3.17 kg 0.19 Rice 200 kg 1.00 lbs 1.21 2.19 kg 0.55 Maize Meal 200 kg 1.13 lbs 1.21 2.49 kg 0.49 Dry Beans 350 kg 1.29 lbs 2.12 2.84 kg 0.75 Groundnuts 300 kg 2.5 lbs 1.82 5.50 kg 0.33 Squash seed 600 kg 4.99 lbs 3.64 10.98 kg 0.33 Veg.Oil 500 lit 1.53 qt 3.03 1.44 lit 2.11 Dairy Eggs 66 ea 1.93 doz 0.40 0.16 ea 2.49 Milk (UHT) 650 kg 2.29 gal 3.94 0.61 lit 6.50 Butter 420 kg 2.66 lbs 2.55 5.84 kg 0.44 Yogurt 1,400 kg 1.00 qt 8.48 0.94 lit 9.07 Bottled water 133.33 lit 0.128 qt 0.81 0.12 lit 6.72 Meat Beef 2,000 kg 4.99 lbs 12.12 10.98 kg 1.10 Chicken 1,800 kg 1.49 lbs 10.91 3.28 kg 3.33 Duck 1,500 kg 2.99 lbs 9.09 6.58 kg 1.38 Pork 1,000 kg 1.99 lbs 6.06 4.38 kg 1.38 Goat/Lamb 1,000 kg 8.99 lbs 6.06 19.78 kg 0.31 Fish 1,000 kg 4.99 lbs 6.06 10.98 kg 0.55 Canned Fish 250 kg 4.96 lbs 1.52 10.91 kg 0.14 Roots & Tubers Cassava 75 kg 1.99 lbs 0.45 4.38 kg 0.10 Sweet Potatoes 500 kg 1.29 lbs 3.03 2.84 kg 1.07 White Potatoes 600 kg 0.79 lbs 3.64 1.74 kg 2.09 Plantains 350 kg 0.99 lbs 2.12 2.18 kg 0.97 Vegetables Tomatoes 75 kg 0.99 lbs 0.45 2.18 kg 0.21 Onions 75 kg 0.79 lbs 0.45 1.74 kg 0.26 Eggplant 100 kg 2.12 lbs 0.61 4.66 kg 0.13 Green Peppers 75 kg 1.05 lbs 0.45 2.32 kg 0.20 Cabbage 300 kg 0.49 lbs 1.82 1.08 kg 1.69 Carrots 300 kg 0.79 lbs 1.82 1.74 kg 1.05 Lettuce 100 kg 1.29 lbs 0.61 2.84 kg 0.21 Fruits Bananas 100 kg 0.49 lbs 0.61 1.08 kg 0.56 Mango 100 kg 1.43 lbs 0.61 3.14 kg 0.19 Oranges 250 kg 1.12 lbs 1.52 2.47 kg 0.61 Lemons 250 kg 1.5 lbs 1.52 3.30 kg 0.46 Fuel Gas 160 lit 2.37 gal 0.97 0.63 lit 1.55 Diesel 135 lit 2.65 gal 0.82 0.70 lit 1.17 Exchange rate US$ = 165 Kz Date: Sept. 2017 -
Egypt
Comparative Consumer Prices (Egypt vs. USA)
Commodity Egypt Price (EL) US Price (US$) Adjusted to US$ & Common Unit Compar-ison Price Unit Price Unit Egypt US Unit Egypt/US General Flour 4.00 Kg 1.13 5 lbs 0.70 0.50 Kg 1.40 Rice 7.00 Kg 2.50 5 lbs 1.22 1.10 Kg 1.11 Salt 4.00 Kg 0.49 lbs 0.70 1.08 Kg 0.65 Sugar 8.00 Kg 2.89 5 lbs 1.39 1.27 Kg 1.09 Foul Beans 7.00 Kg 3.00 4 lbs 1.22 1.65 Kg 0.74 Meat Beef 45.00 Kg 3.99 lbs 7.83 8.78 Kg 0.89 Chicken 16.00 Kg 1.24 lbs 2.78 2.73 Kg 1.02 Lamb 45.00 Kg 4.99 lbs 7.83 10.98 Kg 0.71 Vegetables Tomatoes 5.00 Kg 3.99 lbs 0.87 8.78 Kg 0.10 Carrots 4.00 Kg 0.59 2 lbs 0.70 0.65 Kg 1.07 Garlic 12.00 Kg 3.99 lbs 2.09 8.78 Kg 0.24 Onions 5.00 Kg 1.99 3 lbs 0.87 1.46 Kg 0.60 Spinish 5.00 Kg 1.38 lbs 0.87 3.04 Kg 0.29 Fruits Bananas 7.00 Kg 0.50 lbs 1.22 1.10 Kg 1.11 Apples 20.00 Kg 1.99 lbs 3.48 4.38 Kg 0.79 Dates 20.00 Kg 2.50 lbs 3.48 5.50 Kg 0.63 Steawberries 12.00 Kg 3.99 lbs 2.09 8.78 Kg 0.24 Plums 15.00 Kg 1.69 lbs 2.61 3.72 Kg 0.70 Oranges 3.00 Kg 0.39 lbs 0.52 0.86 Kg 0.61 Conversion Rate US$ = 5.75 EL -
Ethiopia
Comparative Consumer Prices (Ethiopia vs. USA) Commodity Ethiopia Price (Birr) USA Price ($) Adjusted to USA$ & Common Unit Comparison Ratio Price Unit Price Unit Ethiopia USA Unit Eth/USA Dry Goods Flour 14.00 kg 0.40 lbs 0.77 0.88 Kg 0.87 Sugar 111.00 2 kg 0.60 lbs 3.03 1.32 Kg 2.30 Salt 30.53 kg 0.62 lbs 1.67 1.36 Kg 1.22 Cofee 72.00 0.5 kg 4.16 lbs 7.87 9.15 Kg 0.86 Tea 7.20 100 g 28.00 lbs 3.93 61.60 Kg 0.06 Pasta 17.00 kg 1.65 lbs 0.93 3.63 Kg 0.26 Veg.Oil 61.00 lit 1.80 qt 3.33 1.69 lit 1.97 Grains Wheat 15.00 kg 1.39 lbs 0.82 3.06 Kg 0.27 Barley 15.50 kg 1.49 lbs 0.85 3.28 Kg 0.26 Maize Grain 7.50 kg 1.99 lbs 0.41 4.38 Kg 0.09 Teff 22.00 kg 4.92 lbs 1.20 10.82 Kg 0.11 Sorghum 10.00 kg 1.79 lbs 0.55 3.94 Kg 0.14 Sunflower 12.00 kg 2.99 lbs 0.66 6.58 Kg 0.10 Chick Pea 32.00 kg 1.89 lbs 1.75 4.16 Kg 0.42 Lentil Split 32.00 kg 1.89 lbs 1.75 4.16 Kg 0.42 Broad Bean 18.00 kg 0.99 lbs 0.98 2.18 Kg 0.45 Rice 15.00 kg 0.60 lbs 0.82 1.32 Kg 0.62 Groundnuts 25.00 kg 4.99 lbs 1.37 10.98 Kg 0.12 Dairy Eggs 3.00 ea 0.12 ea 0.16 0.12 ea 1.37 Milk 18.00 lit 2.79 gal 0.98 0.74 lit 1.33 Milk (UHT) 53.30 lit 2.79 gal 2.91 0.74 lit 3.95 Butter 140.00 kg 2.50 lbs 7.65 5.50 Kg 1.39 Yogurt 8.40 250 ml 1.99 qt 1.84 1.87 lit 0.98 Meat Beef 188.90 kg 4.99 lbs 10.32 10.98 Kg 0.94 Chicken 126.00 kg 0.98 lbs 6.89 2.16 Kg 3.19 Pork 202.80 kg 3.49 lbs 11.08 7.68 kg 1.44 Goat/Lamb 129.90 kg 5.49 lbs 7.10 12.08 kg 0.59 Fish 256.80 kg 4.99 lbs 14.03 10.98 Kg 1.28 Canned Fish 56.20 425g 4.16 lbs 7.23 9.15 Kg 0.79 Vegetables Tomatoes 10.00 kg 1.19 lbs 0.55 2.62 Kg 0.21 Carrots 10.00 kg 0.79 lbs 0.55 1.74 Kg 0.31 Kale 10.00 kg 2.00 lbs 0.55 4.40 Kg 0.12 Beans 5.00 kg 1.99 lbs 0.27 4.38 Kg 0.06 Onions 5.00 kg 0.88 lbs 0.27 1.94 Kg 0.14 Garlic 20.00 2.99 lbs 1.09 6.58 Kg 0.17 Potatoes 10.00 kg 0.34 lbs 0.55 0.75 Kg 0.73 Cabbage 7.00 kg 0.59 lbs 0.38 1.30 Kg 0.29 Fruits Bananas 12.00 kg 0.56 lbs 0.66 1.23 Kg 0.53 Avocado 15.00 kg 4.70 lbs 0.82 10.34 Kg 0.08 Papaya 15.00 kg 2.00 lbs 0.82 4.40 Kg 0.19 Lemons 20.00 kg 1.99 lbs 1.09 4.38 Kg 0.25 Pineapples 20.00 kg 0.66 lbs 1.09 1.45 Kg 0.75 Mango 43.00 kg 1.76 lbs 2.35 3.87 Kg 0.61 Oranges 25.00 kg 0.99 lbs 1.37 2.18 Kg 0.63 Other Gas 20.00 lit 3.45 gal 1.09 0.91 lit 1.20 Diesel 18.00 lit 3.85 gal 0.98 1.02 lit 0.97 Exchange rate US$ = 18.33 Birr Date: March 2013 -
Ghana
Comparative Consumer Prices (Ghana vs. USA)
Commodity Ghana Price US Price Adjusted to US$ & Common Unit Compar-ison Ratio Price Unit Price Unit Ghana US Unit Gh/US Dry Goods Flour 1.00 kg 0.23 lbs 0.69 0.50 Kg 1.39 Sugar 2.00 kg 0.58 lbs 0.69 1.27 Kg 0.54 Salt 1.00 kg 0.49 lbs 0.69 1.08 Kg 0.64 Pasta 2.40 kg 0.74 lbs 1.66 1.63 Kg 1.02 Soybean 0.79 tin 1.49 lbs 0.54 3.28 Kg 0.17 Rice 0.42 tin 0.50 lbs 0.09 1.10 Kg 0.08 Veg.Oil 2.50 lit 1.54 qt 1.72 1.45 lit 1.19 Coffee 36.00 kg 9.98 lbs 24.83 21.96 Kg 1.13 Cowpeas 1.21 tin 0.54 lbs 0.25 1.19 Kg 0.21 Groundnuts 1.06 kg 1.50 lbs 0.73 3.30 Kg 0.22 Dairy Eggs 0.17 ea 1.03 doz 0.12 0.09 ea 1.39 Milk (Cond) 4.50 kg 4.32 qt 3.10 1.14 lit 2.72 Meat Beef 5.50 kg 3.99 lbs 3.79 8.78 Kg 0.43 Chicken 4.50 kg 1.24 lbs 3.10 2.73 Kg 1.14 Fish 3.00 kg 5.49 lbs 2.07 12.08 Kg 0.17 Canned Fish 3.40 kg 3.29 lbs 2.34 7.24 Kg 0.32 Vegetables Tomatoes 2.50 kg 3.99 lbs 1.72 8.78 Kg 0.20 Carrots 0.40 kg 0.30 lbs 0.28 0.65 Kg 0.43 Beans 0.12 kg 1.00 lbs 0.08 2.20 Kg 0.04 Onions 0.40 kg 0.66 lbs 0.28 1.46 Kg 0.19 Green Pepper 5.00 kg 1.21 lbs 3.45 2.66 Kg 1.30 Potatoes 1.60 kg 0.99 lbs 1.10 2.18 Kg 0.51 Sweet Potatoes 0.50 kg 1.49 lbs 0.34 3.28 Kg 0.11 Cassava 0.23 kg 0.99 lbs 0.16 2.18 Kg 0.07 Cabbage 0.50 kg 0.59 lbs 0.34 1.30 Kg 0.27 Cucumbers 0.50 kg 0.99 lbs 0.34 2.18 Kg 0.16 Fruits Plantain 0.50 kg 1.49 lbs 0.34 3.28 Kg 0.11 Bananas 0.15 kg 0.50 lbs 0.10 1.10 Kg 0.09 Pineapples 1.20 kg 1.43 lbs 0.83 3.14 Kg 0.26 Oranges 0.80 kg 0.69 lbs 0.55 1.52 Kg 0.36 Other Gas 1.14 lit 2.15 gal 0.79 0.57 lit 1.38 Diesel 1.12 lit 2.59 gal 0.77 0.69 lit 1.13 Exchange rate US$ = G 1.45 Date: 20 Octobewr 2009 “Tin” is local vloume measure of approximately 3.3 kg for dry goods -
Kenya
Comparative Consumer Prices (Kenya vs. USA)
Commodity Kenya Price (KSh) US Price Adjusted to US$ & Common Unit Compar-ison Ratio Price Unit Price Unit Kenya US Unit Ke/US Dry Goods Flour 55 kg 0.33 lbs 0.75 0.73 Kg 1.03 Sugar 110 kg 0.50 lbs 1.50 1.10 Kg 1.36 Salt 25 kg 0.49 lbs 0.34 1.08 Kg 0.32 Pasta 173 kg 0.74 lbs 2.35 1.63 Kg 1.44 Rice 90 kg 0.75 lbs 1.22 1.65 Kg 0.74 Veg.Oil 170 lit 1.54 qt 2.31 1.45 lit 1.60 Tea 1 bag 0.03 bag 0.01 0.03 bag 0.43 Coffee 3,180 kg 9.98 lbs 43.27 21.96 Kg 1.97 Cowpeas 100 kg 1.29 lbs 1.36 2.84 Kg 0.48 Maize Flour 90 kg 0.89 lbs 1.22 1.96 Kg 0.63 Dry Beans 80 kg 1.72 lbs 1.09 3.78 Kg 0.29 Green Gram 100 kg 2.49 lbs 1.36 5.48 Kg 0.25 Soybean 65 kg 1.49 lbs 0.88 3.28 Kg 0.27 Groundnuts 90 kg 1.50 lbs 1.22 3.30 Kg 0.37 Dairy Eggs 8 ea 0.11 ea 0.11 0.11 ea 1.01 Milk (UHT) 103 lit 2.19 gal 1.40 0.58 lit 2.42 Milk (Fresh) 60 lit 2.19 gal 0.82 0.58 lit 1.41 Yogurt 146 lit 2.99 qt 1.99 2.81 lit 0.71 Meat Beef 240 kg 3.99 lbs 3.27 8.78 Kg 0.37 Chicken 325 kg 1.59 lbs 4.42 3.50 Kg 1.26 Goat 280 kg 3.98 lbs 3.81 8.76 Kg 0.44 Fish 200 kg 5.49 lbs 2.72 12.08 Kg 0.23 Canned Fish 801 kg 3.29 lbs 10.90 7.24 Kg 1.51 Vegetables Tomatoes 40 kg 3.99 lbs 0.54 8.78 Kg 0.06 Carrots 80 kg 0.60 lbs 1.09 1.32 Kg 0.83 Beans 70 kg 1.25 lbs 0.95 2.75 Kg 0.35 Peas 80 kg 3.99 lbs 1.09 8.78 Kg 0.12 Onions 60 kg 0.82 lbs 0.82 1.80 Kg 0.45 Eggplant 60 kg 1.59 lbs 0.82 3.50 Kg 0.23 Potatoes 40 kg 0.25 lbs 0.54 0.55 Kg 0.99 Sweet Potatoes 29 kg 1.89 lbs 0.39 4.16 Kg 0.09 Zuccani 60 kg 0.99 lbs 0.82 2.18 Kg 0.37 Cassava 70 kg 0.99 lbs 0.95 2.18 Kg 0.44 Cabbage 40 kg 0.59 lbs 0.54 1.30 Kg 0.42 Cucumbers 50 kg 0.99 lbs 0.68 2.18 Kg 0.31 Califlower 100 kg 0.99 lbs 1.36 2.19 Kg 0.62 Green Pepper 70 kg 1.21 lbs 0.95 2.65 Kg 0.36 Spinish 100 kg 2.08 lbs 1.36 4.58 Kg 0.30 Corrinunder 150 kg 1.60 lbs 2.04 3.52 Kg 0.58 Kale 40 kg 2.29 lbs 0.54 5.03 Kg 0.11 Fruits Plantain 27 kg 1.49 lbs 0.36 3.28 Kg 0.11 Bananas 115 kg 0.39 lbs 1.56 0.86 Kg 1.82 Pineapples 50 kg 1.14 lbs 0.68 0.52 Kg 1.31 Mango 60 kg 1.71 lbs 0.82 3.77 Kg 0.22 Papaya 48 kg 1.49 lbs 0.65 0.68 Kg 0.96 Watermellon 45 kg 0.73 lbs 0.61 0.33 Kg 1.86 Other Gas 85 lit 2.15 gal 1.16 0.57 lit 2.03 Diesel 75 lit 2.59 gal 1.02 0.69 lit 1.49 Exchange rate US$ = KSh 73.5 Date: 24 November 2009 -
Madagascar
Comparative Consumer Prices (Madagascar vs. USA) Commodity Madagascar Price (Ar) USA Price ($) Adjusted to USA$ & Common Unit Comparison Ratio Price Unit Price Unit Mad USA Unit Mad/USA Condiments Salt 1,000 / kg 0.36 / lbs 0.30 0.80 / Kg 0.38 Pepper 29,700 / 100g 5.58 / 100g 9.05 5.58 / 100g 1.62 Coffee 18,600 / kg 5.99 / lbs 5.67 13.18 / 100g 0.43 Tea 36,000 / 100g 8.37 / 100g 10.98 8.37 / 100g 1.31 Sugar 2,000 / kg 0.50 / lbs 0.61 1.09 / Kg 0.56 Garlic 8,000 / kg 3.00 / lbs 2.44 6.60 / Kg 0.37 Ginger 8,000 / kg 3.99 / lbs 2.44 8.78 / Kg 0.28 Dry Goods Flour 800 / kg 0.50 / lbs 0.24 1.10 / Kg 0.22 Pasta 3,600 / kg 1.98 / lbs 1.10 4.36 / Kg 0.25 Rice Thai 2,200 / kg 0.75 / lbs 0.67 1.66 / Kg 0.41 Rice Local 1,900 / kg 0.75 / lbs 0.58 1.66 / Kg 0.35 Dry Beans 3,200 / kg 1.49 / lbs 0.98 3.28 / Kg 0.30 Groundnuts 3,000 / kg 2.49 / lbs 0.91 5.48 / Kg 0.17 Veg.Oil 5,200 / lit 1.69 / qt 1.59 1.59 / lit 1.00 Dairy Eggs 550 / ea 0.12 / ea 0.17 0.12 / ea 1.35 Milk (Raw) 3,000 / lit 2.29 / gal 0.91 0.61 / lit 1.51 Butter 12,800 / kg 1.77 / lbs 15.61 3.89 / Kg 4.01 Bottled water 1,675 / lit 0.66 / lit 0.34 0.66 / lit 0.52 Meat Beef 9,000 / kg 4.99 / lbs 2.74 10.98 / Kg 0.25 Chicken 14,000 / kg 1.69 / lbs 4.27 3.72 / Kg 1.15 Pork 8,000 / kg 1.77 / lbs 2.44 3.89 / Kg 0.63 Fish 7,000 / kg 6.99 / lbs 2.13 15.38 / Kg 0.14 Canned Fish 2,800 / 0.25kg 4.85 / lbs 18.54 10.66 / Kg 1.74 Roots & Tubers Cassava 800 / kg 2.49 / lbs 0.24 5.48 / Kg 0.04 Sweet Potatoes 2,000 / kg 0.79 / lbs 0.61 1.74 / Kg 0.35 White Potatoes 2,000 / kg 0.40 / lbs 0.61 0.88 / Kg 0.70 Plantains 2,000 / 0.5kg 1.50 / lbs 0.61 3.30 / Kg 0.18 Vegetables Tomatoes 2,800 / kg 1.29 / lbs 0.85 2.84 / Kg 0.30 Onions 2,800 / kg 0.79 / lbs 0.85 1.74 / Kg 0.49 Eggplant 2,000 / kg 1.49 / lbs 0.61 3.28 / Kg 0.19 Green Peppers 4,000 / kg 1.78 / lbs 1.22 3.92 / Kg 0.31 Cabbage 1,600 / kg 0.79 / lbs 0.49 1.74 / Kg 0.28 Beans 2,000 / kg 1.79 / lbs 0.61 3.94 / Kg 0.15 Carrots 2,000 / kg 0.79 / lbs 0.61 1.74 / Kg 0.35 Cucumbers 2,000 / kg 1.11 / lbs 0.61 2.45 / Kg 0.25 Culifiower 1,800 / kg 1.49 / lbs 0.55 3.28 / Kg 0.17 Squash 1,800 / kg 1.49 / lbs 0.55 3.28 / Kg 0.17 Beets 8,000 / kg 2.99 / lbs 2.44 6.57 / Kg 0.37 Fruits Bananas 1,000 / kg 0.50 / lbs 0.30 1.10 / Kg 0.28 Pineapples 2,000 / kg 0.77 / lbs 0.61 1.69 / Kg 0.36 Mango 2,000 / kg 1.15 / lbs 0.61 2.53 / Kg 0.24 Fuel Gas 4,800 / lit 2.50 / gal 1.46 0.66 / lit 2.21 Diesel 3,500 / lit 2.95 / gal 1.07 0.78 / lit 1.37 Exchange rate US$ = 3280 Ar Date: 27 Oct. 2018 -
Malawi
Comparative Consumer Prices (Malawi vs. USA)
Commodity Malawi Price US Price Adjusted to US$ & Common Unit Compar-ison Ratio Price Unit Price Unit Malawi US Unit Ma/US Dry Goods Sugar 140 kg 0.69 lbs 0.93 1.52 Kg 0.61 Salt 120 kg 0.49 lbs 0.80 1.08 Kg 0.74 Pasta 520 kg 1.53 lbs 3.47 3.37 Kg 1.03 Rice 220 kg 0.64 lbs 1.47 1.41 Kg 1.04 Maize Flour 120 kg 0.84 lbs 0.80 1.85 Kg 0.43 Soybean 350 kg 1.99 lbs 2.33 4.38 Kg 0.53 Veg.Oil 400 kg 2.89 qt 2.67 2.72 lit 0.98 Coffee 1,900 kg 11.88 lbs 12.67 26.14 Kg 0.48 Tea 400 kg 8.99 lbs 2.67 19.78 Kg 0.13 Dry Beans 250 kg 0.54 lbs 1.67 1.19 Kg 1.40 Dairy Eggs 25 ea 0.08 ea 0.17 0.08 ea 2.01 Milk (UHT) 200 lit 0.75 qt 1.33 0.71 lit 1.89 Margine 740 kg 3.00 lbs 4.93 6.60 Kg 0.75 Yogurt 480 lit 2.99 qt 3.20 2.81 lit 1.14 Meat Beef 550 kg 2.49 lbs 3.67 5.48 Kg 0.67 Chicken 390 kg 0.79 lbs 2.60 1.74 Kg 1.50 Pork 1,000 kg 1.13 lbs 6.67 2.49 Kg 2.68 Goat 740 kg 5.02 lbs 4.93 11.04 Kg 0.45 Fish 300 kg 5.49 lbs 2.00 12.08 Kg 0.17 Vegetables Tomatoes 100 kg 1.39 lbs 0.67 3.06 Kg 0.22 Carrots 200 kg 0.65 2 lbs 1.33 0.72 Kg 1.86 Beans 500 kg 2.49 lbs 3.33 5.48 Kg 0.61 Peas 400 kg 2.50 lbs 2.67 5.50 Kg 0.48 Onions 160 kg 0.69 3 lbs 1.07 0.51 Kg 2.11 Eggplant 250 kg 1.99 1.25 lbs 1.67 3.50 Kg 0.48 Potatoes 120 kg 0.70 lbs 0.80 1.54 Kg 0.52 Sweet Potatoes 100 kg 0.79 lbs 0.67 1.74 Kg 0.38 Cassava 150 kg 0.99 lbs 1.00 2.18 Kg 0.46 Cabbage 50 kg 0.67 lbs 0.33 1.47 Kg 0.23 Cucumbers 100 kg 0.75 lbs 0.67 1.65 Kg 0.40 Fruits Bananas 100 kg 0.69 lbs 0.67 1.52 Kg 0.44 Pineapples 160 kg 4.99 3.5 kg 1.07 1.43 Kg 0.75 Mango 200 kg 0.83 14 oz 1.33 0.73 Kg 1.83 Avocado 160 kg 2.00 lbs 1.07 4.40 Kg 0.24 Other Gas 220 lit 1.89 gal 1.46 0.50 lit 2.93 Diesel 199 lit 2.19 gal 1.33 0.58 lit 2.29 Exchange rate US$ = MK 138 Date: 4 Apr. 2009 -
Nigeria
Comparative Consumer Prices (Nigeria vs. USA)
Commodity Nigeria Price US Price Adjusted to US$ & Common Unit Compar-ison Ratio Price Unit Price Unit N igeria US Unit Ni/US Dry Goods Flour 107 kg 0.23 lbs 0.71 0.50 Kg 1.43 Sugar 160 kg 0.58 lbs 1.06 1.27 Kg 0.83 Salt 38 kg 0.49 lbs 0.25 1.08 Kg 0.23 Pasta 200 kg 0.74 lbs 1.32 1.63 Kg 0.81 Rice (local pb) 400 mudu 0.50 lbs 1.06 1.10 Kg 0.96 Veg.Oil 300 lit 1.54 qt 1.99 1.45 lit 1.37 Tea 4 bag 0.03 bag 0.03 0.03 bag 0.97 Coffee 4,600 kg 9.98 lbs 30.46 21.96 Kg 1.39 Cowpeas 370 mudu 0.54 lbs 0.98 1.19 Kg 0.83 Sesame 500 mudu 3.39 lbs 1.32 7.46 Kg 0.18 Groundnuts 350 mudu 1.50 lbs 0.93 3.30 Kg 0.28 Dairy Eggs 25 ea 0.11 ea 0.17 0.11 ea 1.51 Milk Power 1,444 kg 3.42 lbs 9.57 7.52 Kg 1.27 Meat Beef 800 kg 3.99 lbs 5.30 8.78 Kg 0.60 Goat 400 kg 3.98 lbs 2.65 8.76 Kg 0.30 Fish 250 kg 5.49 lbs 1.66 12.08 Kg 0.14 Canned Fish 944 kg 3.29 lbs 6.25 7.24 Kg 0.86 Vegetables Tomatoes 100 kg 3.99 lbs 0.66 8.78 Kg 0.08 Carrots 250 kg 0.60 lbs 1.66 1.32 Kg 1.25 Beans 250 kg 1.25 lbs 1.66 2.75 Kg 0.60 Onions 250 kg 0.66 lbs 1.66 1.46 Kg 1.13 Eggplant 60 kg 1.59 lbs 0.40 3.50 Kg 0.11 Potatoes 83 kg 0.99 lbs 0.55 2.18 Kg 0.25 Sweet Potatoes 50 kg 1.49 lbs 0.33 3.28 Kg 0.10 Cabbage 100 kg 0.59 lbs 0.66 1.30 Kg 0.51 Cucumbers 100 kg 0.99 lbs 0.66 2.18 Kg 0.30 Fruits Plantain 150 kg 1.49 lbs 0.99 3.28 Kg 0.30 Bananas 200 kg 0.50 lbs 1.32 1.10 Kg 1.20 Pineapples 300 ea 4.99 ea 1.99 4.99 ea 0.40 Papaya 600 ea 2.98 ea 3.97 2.98 ea 1.33 Other Gas 65 lit 2.15 gal 0.43 0.57 lit 0.76 Diesel 116 lit 2.59 gal 0.77 0.69 lit 1.12 Exchange rate US$ = N 151 Date: 23 September 2009 Mudu is a local vloume measure of approximately 2.5 kg used for dry goods -
Tanzania
Comparative Consumer Prices (Tanzania vs. USA)
Commodity Tanzania Price (TSh) US Price (US$) Adjusted to US$ & Common Unit Compar-ison Price Unit Price Unit Tan US Unit Tan/US Dry Goods Flour (wheat) 650 Kg 1.13 5 lbs 0.51 0.50 Kg 1.02 Sugar 1000 Kg 2.89 5 lbs 0.78 1.27 Kg 0.61 Salt 300 Kg 0.49 lbs 0.23 1.08 Kg 0.22 Maize Meal 300 Kg 0.99 lbs 0.23 2.18 Kg 0.11 Rice 850 Kg 2.50 5 lbs 0.66 1.10 Kg 0.60 Veg.Oil (local) 1700 lt 1.54 qt 1.32 1.45 lit 0.91 Veg.Oil (imported) 1500 lt 1.54 qt 1.17 1.45 lit 0.81 Tea 2400 Kg 4.99 11 oz 1.87 15.97 Kg 0.12 Coffee 8000 Kg 9.98 lbs 6.23 21.96 Kg 0.28 Dry Beans 600 Kg 0.54 lbs 0.47 1.19 Kg 0.39 Poultry Eggs 150 Each 1.03 doz 0.12 0.09 ea 1.36 Dairy Milk 400 lt 1.99 0.5 gal 0.31 0.94 lit 0.33 Butter 4000 Kg 3.99 lbs 3.12 8.78 Kg 0.35 Yogurt 400 lt 2.99 qt 0.31 2.81 lit 0.11 Meat Beef 2000 Kg 3.99 lbs 1.56 8.78 Kg 0.18 Chicken 4000 Kg 1.24 lbs 3.12 2.73 Kg 1.14 Goat 2000 Kg 3.00 lbs 1.56 6.60 Kg 0.24 Pork 1600 Kg 1.34 lbs 1.25 2.95 Kg 0.42 Fish 2500 Kg 5.49 lbs 1.95 12.08 Kg 0.16 Vegetables Tomatoes 1,000 Kg 3.99 lbs 0.78 8.78 Kg 0.09 Carrots 1,000 Kg 0.59 2 lbs 0.78 0.65 Kg 1.20 Beans 600 Kg 1.00 lbs 0.47 2.20 Kg 0.21 Peas 700 Kg 3.99 lbs 0.55 8.78 Kg 0.06 Onions 1,500 Kg 1.99 3 lbs 1.17 1.46 Kg 0.80 Eggplant 1,500 Kg 1.99 1.25 lbs 1.17 3.50 Kg 0.33 Potatoes 1,000 Kg 0.99 lbs 0.78 2.18 Kg 0.36 Sweet Potatoes 1,000 Kg 1.49 lbs 0.78 3.28 Kg 0.24 Cassava 500 Kg 0.99 lbs 0.39 2.18 Kg 0.18 Cabbage 1,500 Kg 0.59 lbs 1.17 1.30 Kg 0.90 Cucumbers 500 Kg 0.99 lbs 0.39 2.18 Kg 0.18 Fruits Plantain 200 Kg 1.39 lbs 0.16 3.06 Kg 0.05 Bananas (ripe) 800 Kg 0.50 lbs 0.62 1.10 Kg 0.57 Pineapples 1,500 Kg 4.99 3.5 kg 1.17 1.43 Kg 0.82 Mango 500 Kg 1.50 14 oz 0.39 1.31 Kg 0.30 Avocado 500 Kg 2.66 lbs 0.39 5.85 Kg 0.07 Pawpaw (Papaya) 1,000 Kg 2.00 lbs 0.78 4.40 Kg 0.18 Other Gas 1,300 lt 2.15 gal 1.01 0.57 lit 1.78 Diesel 1,280 lt 2.59 gal 1.00 0.69 lit 1.45 Exchange Rate: US$ = 1284 TSh, Price are for February 2007 -
Uganda
Comparative Consumer Prices (Uganda vs. USA)
Commodity Uganda Price (USh) US Price (US$) Adjusted to US$ & Common Unit Ratio Price Unit Price Unit Uganda US Unit Ug/US Dry Goods Flour 1,500 kg 1.13 5 lbs 0.94 0.50 Kg 1.89 Sugar 1,800 kg 2.89 5 lbs 1.13 1.27 Kg 0.88 Salt 800 kg 0.49 lbs 0.50 1.08 Kg 0.46 Pasta 3,600 kg 1.79 lbs 2.25 3.94 Kg 0.57 Rice 1,700 kg 2.50 5 lbs 1.06 1.10 Kg 0.97 Maize Flour 1,200 kg 0.99 lbs 0.75 2.18 Kg 0.34 Veg.Oil 2,800 lit 1.54 qt 1.75 1.45 lit 1.21 Coffee 5,200 kg 9.98 lbs 3.25 21.96 Kg 0.15 Dry Beans 1,200 kg 0.54 lbs 0.75 1.19 Kg 0.63 Dairy Eggs 4,700 tray 1.03 doz 0.10 0.09 ea 1.14 Milk (UHT) 2,000 lit 3.98 gal 1.25 0.94 lit 1.34 Yogurt 1,500 lit 2.99 qt 0.94 2.81 lit 0.33 Meat Beef 4,500 kg 3.99 lbs 2.81 8.78 Kg 0.32 Chicken 7,000 kg 1.24 lbs 4.38 2.73 Kg 1.60 Pork 3,500 kg 1.34 lbs 2.19 2.95 Kg 0.74 Goat 4,000 kg 3.00 lbs 2.50 6.60 Kg 0.38 Fish 3,000 kg 5.49 lbs 1.88 12.08 Kg 0.16 Vegetables Tomatoes 1,500 kg 3.99 lbs 0.94 8.78 Kg 0.11 Carrots 1,500 kg 0.59 2 lbs 0.94 0.65 Kg 1.44 Beans 3,000 kg 1.00 lbs 1.88 2.20 Kg 0.85 Peas 1,000 kg 3.99 lbs 0.63 8.78 Kg 0.07 Onions 1,500 kg 1.99 3 lbs 0.94 1.46 Kg 0.64 Eggplant 2,000 kg 1.99 1.25 lbs 1.25 3.50 Kg 0.36 Potatoes 400 kg 0.99 lbs 0.25 2.18 Kg 0.11 Sweet Potatoes 500 kg 1.49 lbs 0.31 3.28 Kg 0.10 Cassava 500 kg 0.99 lbs 0.31 2.18 Kg 0.14 Garlic 6,000 kg 1.44 lbs 3.75 3.17 Kg 1.18 Ginger 2,500 kg 2.99 lbs 1.56 6.58 Kg 0.24 Cabbage 500 kg 0.59 lbs 0.31 1.30 Kg 0.24 Green Pepers 1,500 kg 1.76 lbs 0.94 3.87 Kg 0.24 Fruits Plantain 500 kg 1.29 lbs 0.31 2.84 Kg 0.11 Bananas 1,000 kg 0.50 lbs 0.63 1.10 Kg 0.57 Pineapples 1,500 ea 4.99 3.5 kg 0.94 1.43 Kg 0.66 Mango 500 ea 1.50 14 oz 0.31 1.31 Kg 0.24 Papaya 1,500 kg 0.69 lbs 0.94 1.52 Kg 0.62 Other Gas 2,680 lit 3.89 gal 1.68 1.03 lit 1.63 Diesel 2,600 lit 4.69 gal 1.63 1.24 lit 1.31 Exchange rate US$ = UShs 1600 -
Zambia
Comparative Consumer Prices (Zambia vs. USA) Commodity Zambia Price (ZMK) US Price ($) Adjusted to US$ & Common Unit Comparison Ratio Price Unit Price Unit Zambia US Unit Za/US Condiments Salt 7.5 kg 0.36 lbs 0.62 0.79 kg 0.78 Coffee 224.0 kg 5.99 lbs 18.56 13.18 kg 1.41 Tea 14.0 40 bags 8.37 100 g 0.97 18.41 100 g 0.05 Sugar 13.0 kg 0.50 lbs 1.08 1.10 kg 0.98 Dry Goods (Wheat) Flour 15.0 kg 0.50 lbs 1.24 1.10 kg 1.13 Pasta 12.0 kg 1.98 lbs 0.99 4.36 kg 0.23 Rice 13.0 kg 0.75 lbs 1.08 1.65 kg 0.65 Maize Meal 3.2 kg 1.99 lbs 0.27 4.39 kg 0.16 Groundnuts 30.0 kg 2.49 lbs 2.49 5.48 kg 0.45 Veg.Oil 22.0 lit 1.69 qt 1.82 1.59 lit 1.15 Dairy Eggs 1.0 ea 0.12 ea 0.08 0.12 ea 0.69 Milk (UHT) 10.0 lit 2.29 gal 0.83 0.61 lit 1.37 Butter 200.0 kg 1.77 lb 16.57 3.89 kg 4.26 Yogurt 40.0 kg 2.99 qt 3.31 2.81 lit 1.18 Meat Beef 45.0 kg 4.99 lbs 3.73 10.98 kg 0.34 Chicken 30.0 kg 1.69 lbs 2.49 3.72 kg 0.67 Pork 40.0 kg 1.77 lbs 3.31 3.89 kg 0.85 Goat/Lamb 35.0 kg 7.99 lbs 2.90 17.58 kg 0.16 Fish 15.0 kg 6.99 lbs 1.24 15.38 kg 0.08 Roots & Tubers Cassava 5.0 kg 2.49 lbs 0.41 5.48 kg 0.08 Sweet Potatoes 15.0 kg 0.79 lbs 1.24 1.74 kg 0.72 White Potatoes 6.7 kg 0.40 lbs 0.56 0.88 kg 0.63 Vegetables Tomatoes 10.0 kg 1.29 lbs 0.83 2.84 kg 0.29 Onions 6.7 kg 0.79 lbs 0.56 1.74 kg 0.32 Eggplant 8.0 kg 1.49 lbs 0.66 3.28 kg 0.20 Green Peppers 24.0 kg 1.78 lbs 1.99 3.92 kg 0.51 Cabbage 7.0 kg 0.79 lbs 0.58 1.74 kg 0.33 Beans (green) 19.0 kg 1.79 lbs 1.57 3.94 kg 0.40 Carrots 10.0 kg 0.79 lbs 0.83 1.74 kg 0.48 Cucumbers 20.0 kg 1.11 lbs 1.66 2.44 kg 0.68 Squash 18.0 kg 1.49 lbs 1.49 3.28 kg 0.45 Okra 13.0 kg 1.25 lbs 1.08 2.75 kg 0.39 Fruits Bananas 8.0 kg 0.50 lbs 0.66 1.10 kg 0.60 Pineapples 13.0 ea 2.69 ea 1.08 2.69 ea 0.40 Mango 8.0 ea 1.15 lbs 0.66 2.53 kg 0.26 Oranges 6.0 ea 0.69 lbs 0.50 1.52 kg 0.33 Apple 5.0 ea 0.5 ea 0.41 0.50 ea 0.83 Fuel Gas 16.1 lit 2.50 gal 1.33 0.66 lit 2.01 Diesel 14.7 lit 2.95 gal 1.21 0.78 lit 1.56 Exchange rate US$ = 12.07 (ZMK) Date: December 16, 2018 -
Bolivia
Comparative Consumer Prices (Bolivia vs. USA)
Commodity Bolivia Price (Bs) US Price (US$) Adjusted to US$ & Common Unit Compar-ison Ratio Price Unit Price Unit Bolivia US Unit Bo/US Dry Goods Flour 5.50 kg 1.13 5 lbs 0.73 0.50 Kg 1.47 Sugar 4.00 kg 2.89 5 lbs 0.53 1.27 Kg 0.42 Salt 0.50 kg 0.49 lbs 0.07 1.08 Kg 0.06 Pasta 7.00 kg 1.79 lbs 0.93 3.94 Kg 0.24 Rice 8.00 kg 2.50 5 lbs 1.07 1.10 Kg 0.97 Veg.Oil 13.00 lit 1.54 qt 1.73 1.45 lit 1.20 Coffee 6.00 kg 9.98 lbs 0.80 21.96 Kg 0.04 Lentils 12.00 kg 1.09 lbs 1.60 2.40 Kg 0.67 Dry Beans 10.00 kg 0.54 lbs 1.33 1.19 Kg 1.12 Dairy Eggs 0.50 ea 1.03 doz 0.07 0.09 ea 0.78 Milk (UHT) 5.00 lit 1.99 0.5 gal 0.67 0.94 lit 0.71 Yogurt 10.00 lit 2.99 qt 1.33 2.81 lit 0.47 Meat Beef 16.00 kg 3.99 lbs 2.13 8.78 Kg 0.24 Chicken 14.00 kg 1.24 lbs 1.87 2.73 Kg 0.68 Pork 18.00 kg 1.34 lbs 2.40 2.95 Kg 0.81 Fish 8.00 kg 5.49 lbs 1.07 12.08 Kg 0.09 Vegetables Tomatoes 8.00 kg 3.99 lbs 1.07 8.78 Kg 0.12 Carrots 4.00 lbs 0.59 2 lbs 1.17 0.65 Kg 1.81 Beans 4.00 lbs 1.00 lbs 1.17 2.20 Kg 0.53 Beets 3.40 lbs 0.99 lbs 1.00 2.18 Kg 0.46 Onions 7.00 6 lbs 1.99 3 lbs 0.34 1.46 Kg 0.23 Potatoes 9.00 6 lbs 0.99 lbs 0.44 2.18 Kg 0.20 Cassava 5.00 6 lbs 0.99 lbs 0.24 2.18 Kg 0.11 Cabbage 3.00 8 lbs 0.59 lbs 0.11 1.30 Kg 0.08 Cucumbers 1.00 0.75 lbs 0.99 lbs 0.39 2.18 Kg 0.18 Fruits Plantain 3.93 kg 1.29 lbs 0.52 2.84 Kg 0.18 Bananas 6.17 kg 0.50 lbs 0.82 1.10 Kg 0.75 Papaya 5.44 kg 0.99 lbs 0.73 2.18 Kg 0.33 Peaches 5.00 lbs 1.69 lbs 0.67 3.72 Kg 0.18 Pemelo 2.50 ea 1.50 ea 0.33 1.50 ea 0.22 Grapes 5.00 lbs 2.99 lbs 1.47 6.58 Kg 0.22 Other Gas 3.74 lit 2.15 gal 0.50 0.57 lit 0.88 Diesel 4.00 lit 2.59 gal 0.53 0.69 lit 0.78 Exchange rate US$ = 7.5 Bolivianos (Bs) -
Guatamala
Comparative Consumer Prices (Guatemala vs. USA)
Commodity Guatemala Price US Price Adjusted to US$ & Common Unit Compar-ison Ratio Price Unit Price Unit Guatemala US Unit GT/US Dry Goods Flour (breads) 15.19 kg 0.49 lbs 1.90 1.08 Kg 1.76 Corn tortillas 4.25 kg 1.25 lbs 0.53 2.75 Kg 0.19 Sugar 3.10 kg 0.78 lbs 0.39 1.72 Kg 0.23 Salt 0.32 kg 0.49 lbs 0.04 1.08 Kg 0.04 Pasta 5.71 kg 0.82 lbs 0.71 1.80 Kg 0.40 Rice 3.99 kg 0.75 lbs 0.50 0.33 Kg 1.51 Veg.Oil 14.50 Lit. 1.70 qt 1.81 1.60 lit 1.13 Coffee 24.51 kg 2.28 lbs 3.06 5.02 Kg 0.61 Dry Beans 5.44 kg 1.80 lbs 0.68 3.96 Kg 0.17 Dairy Eggs 12.68 doz 1.69 doz 0.13 0.14 ea 0.94 Milk (UHT) 11.28 Lit. 2.59 gal 1.41 0.69 lit 2.06 Cheese 24.63 kg 2.99 lbs 3.08 6.58 Kg 0.47 Yogurt 7.84 Lit. 2.99 qt 0.98 2.81 lit 0.35 Meat Beef 9.77 kg 3.99 lbs 1.22 8.78 Kg 0.14 Chicken 12.02 kg 1.24 lbs 1.50 2.73 Kg 0.55 Vegetables Tomatoes 5.76 kg 1.39 lbs 0.72 3.06 Kg 0.24 Beans 6.52 kg 2.99 lbs 0.82 6.58 Kg 0.12 Onions 4.60 kg 0.99 lbs 0.58 2.18 Kg 0.26 Potatoes 4.68 kg 0.97 lbs 0.59 2.13 Kg 0.27 Guisquil (gourd) 3.78 kg 0.88 lbs 0.47 1.94 Kg 0.24 Fruits Plantain 0.33 kg 1.49 lbs 0.04 3.28 Kg 0.01 Bananas 2.76 kg 0.50 lbs 0.35 1.10 Kg 0.31 Other Gas 27.00 Lit. 2.89 gal 3.38 0.76 lit 4.41 Diesel 25.00 Lit. 3.19 gal 3.13 0.84 lit 3.70 Exchange rate US$ = 8 quetzales per 1 USD Dec 2010
Financially Stalled Governments
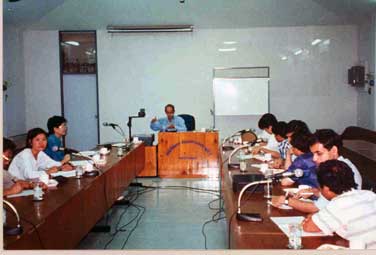 One of the results of the suppressed economic conditions in developing countries, in which annual income of the host equals the monthly income of the advisor and nearly 80% of income is needed to meet basic necessities, that still may not provide Adequate Caloric Energy for a full day of diligent agriculture field work, there is very little money for paying taxes to support civil services. The tax base can only come from the limited discretionary funding that is virtually invisible on the graph of the Financially Suppressed economy page Attempts to derive taxes from essential spending can only be done at severe hardships to the main populations and can easily lead to civil disruption.
This limited tax base very much restricts the civil services that can be provided with revenue funds. The net impact of this is that most revenue funds, often exceeding 80% or of the budget, are obligated for personnel benefits such as salary, pensions, health care and often housing. This leaves very limited funds to operate programs in terms of supplies, equipment, vehicles, fuel, travel allowances, etc. The ultimate result is that most civil servants, regardless of how well motivated, trained or organized, are confined to their respective offices visiting among themselves and consuming large amounts of coffee, tea, etc. with little opportunity to interact with their clients. In effect, the government programs are financially stalled. When government programs are effectively financially stalled they become more a tax burden to the population than an effective provider of civil services. This would include agriculture research and extension program that are often largely left to the NGOs to facilitate, as noted by virtually all Variety Improvement work of major crops is done by IARCs that are part of the CGIAR system.
-
Read More About Financially Stalled Government
It also results in low salaries so that by financial necessity many civil servants seek supplemental income and actively look for opportunities within their job as well as secondary employment. Within jobs, supplemental income can be fully upfront such as shifting around with different development projects for the salary top-ups available from donor projects, participating in training programs for the per diem received by the participants or the honorarium received for instructing. It could also include obtaining project lands for private cultivation as was the case in Madibira. It could also come from less legitimate forms of informal income such as quietly insisting on gratuities for assisting with loan applications, payments to approve certified seed inspections, overlooking informal irrigation schemes such as the 30,000 ha in Southern Tanzania, illegal wells as in Southern Iraq, or accepting money for assisting in getting land allocations even at the expense of designated beneficiaries as appears to be happening in Madibira after donor funding ended. It can become a very gray area in distinguishing between legitimate gratuities freely offered to underpaid civil servants for services rendered and outright graft and corruption.
Lamentable, the prospects of obtaining inform income is often a recruitment incentive for joining the civil services and considerable amount of organizational and managerial skills can be devoted to the pursuit of informal income opportunities. This is usually accompanied by the very autocratic, nearly supervisory, administrative style civil servants adopt in dealing with the populations they are supposed to serve. This can serve as an effective deterrent to anyone questioning the governing authority. This pursuit of informal income and accompanying leadership style may be illustrated by the Seed & Fertilizer Voucher Program in Afghanistan. Regrettable, in the context of developing country governances this is usually accepted as the norm.
All of this has to be examined in terms of the overall economic and administrative environment in which these people are being asked to operate, and recognize that most donor professionals would become just as involved if they were placed in that environment. Perhaps the best analysis would be the old adage “there by the grace of god go I”.
This also results in donor dependency for much of the services, such as agriculture research and extension, intended to benefit smallholder producers. However, donor funding is usually funneled through development projects with some specific objectives or targeting a specific area. These funds are usually available for a limited time period, usually between five and ten years. After that the project is graduated or left to government to continue with its limited revenue funds. Since these funds are rarely there and the economic development effort has not effectively increased the tax base to cover these costs the development effort will be caught up in the limited revenue funds and financially stall.
One of the big challenges for donor projects is to be fully cognizant of the financial limitations and potential for financially stalling once donor assistance has ended. This can be a major problem when donors model their assistance on what is possible in their home country with its enhanced tax base, and try to impose it on a developing country client with much more limited tax base. This would include such programs like soil testing and certified seeds, that are taken for granted in developed countries. Typically the result will be the recruitment of the professional staff and much of the technician staff. The professional staff could then be provide with substantial international post graduate training and facilities provided with all the latest and appropriate field and laboratory equipment. All of this will be much appreciated, if not actually demanded by the host clients, who want a state of the art research and extension program as defined in developed countries. However, once the donor funds end, which will often coincide with the return of the international trainees and arrival of the sophisticated equipment, the program will revert to the limited revenue funds. This can result in the continuation of the development effort stalling and much of the expensive equipment procured being unused and often stored in its original packing crates, never opened. Not a very effective or sustainable return on the development investment effort.
Unfortunately, when this happens, the development effort may be more a disservice to the host government than an effective contribution to their economic development effort.
In the agricultural research and extension effort the most sustainable programs might be simply to concentrate variety improvement by importing and evaluating germ plasma. Normally, this is about the only research activity that is sustained with revenue funds, although a consderable portion is now only done as part of IARCs outreach programs. It also offers the most impact as most other crop management activities have either highly local specificity such as fertilizer rates, or interact strongly with the limited operational resources available to the farmers. This would impact on time of planting and plant density studies. For extension it would mean getting away from the traceable administrative link to all smallholders with all the village extension workers that implies, and concentrate on mass media communications systems. Are revenue funds effectively available for a more concentrated extension effort?
Variety Improvement: Deferred to IARCs
 As host governments budgets become progressively squeezed to the point that many government services are basically Financially Stalled one of the first agriculture support services sacrificed is the variety improvement with accompanying seed multiplication and certification programs. With the balk of government revenues required just to meet contract obligations to its officers in terms of salaries and fringe benefits there are virtually no funds for operating costs.
After the initial acceptance of high yielding varieties these programs have always had a small but additive incremental impact that is difficult to show except through long term multi-year analysis. Thus, for governments trying to invest their limited financial resources, not already obligated to personnel needs, where they will have the best chance for short term impact, it is difficult to provide variety improvement with the significant funding for what is basically a fairly expensive program to implement. Therefore, in many developing countries the variety improvement efforts have been deferred to collaboration with the different IARCs that make up the CGIAR network and their out-reach programs for assisting NARS. These restricted variety improvement programs would include Tanzania, Nigeria, Malawi, Ghana, Kenya, etc. The IARCs can only covers the crops each IARCs is internationally mandated to work with. However, that mandate covers most of the major staple crops grown throughout the developing world. Chief among these are maize working with CIMMTY, rice working with IRRI and WARDA, cassava and soybeans working with IITA, beans working with CIAT, and sorghum working with ICRISAT. For crops with no IARC support, the variety improvement is simply dropped as is the case for sesame, one of the six value chain commodities being promoted by the USAID funded MARKETS project in Nigeria and other West African countries. In this case producers, processors, and seed companies are on their own to identify and distribute new varieties.
-
Read More About Variety Improvement: Deferred to IARCs
While the IARCs are doing the major breeding and variety selection work, the host country scientists are collaborating with the international scientists and mostly operating on the IARC’s operational budget instead of the national revenue budget, except for contracted personnel costs as mentioned above. This can be reasonable effective for at least getting fresh genetic material into a host country and new varieties released for distribution. Typically, new varieties of a crop are released about once every four or five years. The CGIAR’s IARCs distribution of genetic material among developing countries NARS is perhaps the greatest contribution they have made to agriculture development and food security over the past 50 years. Virtually every improved Indicia rice variety grown in the developing world has an IRRI contribution at some point. Once developed and released the varieties are turned over to the host government for multiplication and distribution. The expected result is certified seed being available to all farmers across the country each year. This is consistent with the perceived blanked use of certified seed in developed countries. However, usually there aren’t the government financial resources to operate a seed multiplication program capable of moving seed from breeder seed, to foundation seed, to registered seed, and finally certified seed for sale to farmers. Usually local professional and technical personnel are available sufficiently trained in seed technology to implement a seed quality program if they had adequate funds. Without the operational funds the multiplication and distribution of new varieties are financially stalled. In Kenya IITA and CIAT recently developed five soybean varieties for release the government. However, after release, it was impossible to determine what became of the Seed Multiplication Effort, or when the seeds would be available to the farmers. Even if the seed is multiplied to registered seed and this is contracted out for production to certified seed, the seed inspection officers are too few to undertake the internationally recognized inspection requirements of three field visits usually designated as:
- Early season to assure isolation from cross contamination from other lines,
- Mid season to assure physiological uniformity of the plants, and
- Harvest for seed inspection and germination analysis
 In Nigeria there is only one seed certification team per state to cover a multitude of intended seed multiplication fields that are often less than a hectare each. Physically this can’t be done, even if there was vehicles available with unlimited fuel and other operational resources available to make the necessary field trips, or even if authorized to use public transportation. There just is not enough time for one seed certification inspection teams to make the mandated number of field visits. Thus most of the certification has to be done on the honor system, or perhaps on the gratuity/baksheesh system. Unfortunately, encouraging and investing in a seed certification system in many developing countries could do little more than provide an excellent opportunity for seed officers to supplement their limited official salaries with some Informal DSC02858-WebIncome at the expense of a seed quality. The resulting seed supply is most likely little, if at all, better than that informally circulating within communities or local markets. Certainly, it would not justify the premium price being charged, presumable to justify the extra production costs as well as transportation costs from producer fields to remote growers’ fields. Thus in Nigeria the vast majority of the “certified seed” is marketed to the government for their subsidized seed distribution program, with very little sold on the open market. Whether this“certified” seed can actually be delivered on time is an open question. It may be Piled Up at the ADPs, unsold, because it was delivered too late and without any variety identification to be used.
Certified Seed: How Critical?
This brings forth the question of, how critical is certified seed compared with the locally retained and marketed seed. While most development project personnel, host country professionals and commercial or public sector seed companies swear by the necessity of having certified seed, for self-pollinating crops there could be little, if any, difference. The problem is to look closely at the vested interest of the people involved in promoting or insisting on certified seed. Certainly the commercial and public sector seed companies have a vested interest in promoting the sale of their products. Likewise, the host officials have vested interest in supporting their involvement as well as potential Informal Income opportunities as mentioned above. The development personnel may not have a personal vested interest, but they expect the host country seed program to be on par with their home country seed programs and go along with their hosts. After all they claim they are following the same internationally recognized procedures.
However, unless there is some substantial out-crossing, more than the three percent associated with rice, there will be little if any genetic deterioration between generations of retained seed. The biggest problem would be contamination by trash such as chaff, stones, mud clods and weed seed. All of these can easily be removed, if need be. Of these the biggest problem in manually planted areas, that would include most smallholder communities, is the weed seed. It will impact on the weeding requirements of the pending crop. The inert manner will not be a problem unless mechanically planting machine and the trash jams the planters. It should also be noted, contrary to the impression often conveyed to developing countries, 70% or more of the wheat crop in Colorado and most like other western states in the USA are planted to retained seed. Similar in excess of 90% of crop land in most smallholder communities is planted with retained seed. Even rice, with it three percent out crossing, can be retained for four or five generations between obtaining certified seed, or indefinitely if the farmers rouge out the off-types. However, that is something rarely done, even after training. Apparently, the benefits do not justify the extra time and effort. At least that was the case in Ghana.
Private seed companies in developing countries are reluctant to produce seed for self-pollinated crops since they rely on repeat business that is minimal for self-pollinated seeds. They prefer concentrating on crops with a hybrid seeds potential such as maize and sunflowers. These seeds need to be replaced each season. However, this provides a massive logistic problem that rarely penetrates to smallholder communities, or at least with sufficient amounts to be effective.When the supply logistics breakdown for even a single season forcing the farmers to resort to retained seed, the F2 generation of the hybrid will segregate resulting in an uneven low yielding crop. Thus for open pollinated varieties to conveniently serve smallholder communities the need is more for composite varieties that can be open pollinated without substantial yield decline, then hybrid varieties. Commercial seed companies also prefer to import vegetable seed which requires fresh seed each year. For vegetables the seed is often included with the harvested fruit, or the plant is harvested prior to seed setting. Also, vegetable seeds are often small so small amounts with minimal transportation costs can cover a large area.
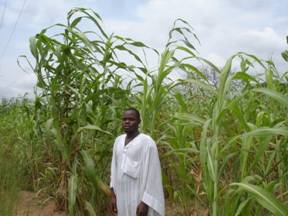
Ultimately, despite the collaborative development of improved lines through the IARCs few of the new lines for some of the major crops reach the smallholder producers. The smallholders are effectively left on their own with only retained seed informally distributed through the communities. An example is the photo at the top of the page where a Nigerian farmer is growing sorghum that is over three meters tall. Certainly, ICRISAT has produced shorter more productive varieties. Often under these conditions the crops have completely lost their formal variety identity. While there may be some local understanding of the differences between varieties being grown in an areas, this can no longer be coordinated with varieties used in other parts of the country or region. For many crops such as maize, soybeans, sorghum etc. where the grain quality is not a major factor in the utilization, the loss of variety identity may not appear critical. However, in addition to grain quality the variety usually impacts on crop morphology that will effects the manner it is produced, and pathogen resistance that will get lost with the variety identity.
SeedYieldMadibiraEven when the variety identification is retained and farmers are all using improved plant types how much difference can be expected between certified seed and that retained within the community. This can often be difficult to determine as shown by a study of rice varieties in Madibira, Tanzania that compared seed being distributed by the project with the same variety being informally distributed within the community. It was not possible to show any significant difference between source and most of the time the framers’ seeds out-yielded the project seed as shown in the table.
In Tanzania and Ghana there has been no influx of rice genetic material from IRRI or WARDA for over 10 years. What fresh genetic material that is moving into a community is done informally. This can result from visits to distant relative, or farmer study visits, etc. In Madibira, Tanzania one of the most popular varieties is Zambia. This is not a recognized variety either in Tanzania or Zambia. Most likely some rice farmer slipped across the border to visit friends or family in Zambia, saw a rice variety he liked, and returned with a handful of seed which he grew out, shared with his neighbors, forgot what the variety was, started referring to it as Zambia, and it was quietly multiplied and distributed to become an established variety in the region. A similar thing happened in Nigeria where an interviewed farmer indicated he grew a variety referred to as Cameroon that was obtained during an informal visit to that neighboring country. It was then quietly multiplied and distributed, but drew a lecture from the ADP officers, intent on promoting only released varieties.
Genetic Pump: The solution to this problem is for NGO’s working with smallholder communities to endorse the use of retained seed within the village in what might best be called a Genetic Pump of improved germ plasma. Basically by-pass the government seed multiplication programs, and go directly to the IARC’s doing the actual variety development for crops of interest. From them obtain small quantities of seed for selected lines, perhaps 10 lines at most. Most IARC breeders are usually willing to allow a small sample of seeds to be distributed to private individuals and organization, particularly if the recipient is willing to participate in verification trials (which are the final trials before a variety is formally release and normally done on-farm) and report the results back. In Nigeria one enterprising individual did this to obtain some cassava cutting of lines being considered by IITA, only to find them better suited for cassava flour instead of garri.
The seed obtained from such informal contacts with the IARC could be as little as 100g of seed per line, the amount most IARCs distribute for their observation trials of small grains or legumes. Return this to the community and either grow the nursery in the NGO’s trial plot or through a cooperating farmer. This will give the whole community a chance to exam the lines. They can accept or reject what they like. Hold the seed for planting the next season. Since most grain or legume crops have at least a 40 to 1 multiplication, the 100 g will become 4 kg the first season, then 160 kg the second season and 6400 kg after the third season. At 50 kg/ha seeding rate this will be enough to plant 128 ha, which is more than enough to have it an established variety within the community. If the farmers don’t like the variety it will simple disappear with very little risk involved. It is actually highly desirable to have five or six established varieties in community to protect against a breakdown of resistance to a pathogen causing a complete loss of a crop.
This needs to be repeat about once every four or five years as that is how long it really takes to identify a few new varieties. The host country seed program will most likely resist this effort, but will not effectively be able to do anything about it, and the smallholders will get access to the new genetic material they need. This could then fairly easily and informally slip out to neighboring communities. Given the overall financial limitations of the host government is there really any alternative.
Informal Income Opportunities: Seed – Fertilizer Voucher Program
 One of the common and unfortunate aspects of developing country governance with their Financially Stalled Civil Services and poorly paid civil servants is the financial necessity of the civil servants to seek informal income opportunities from within their jobs and the development projects associated with their jobs. In doing so, a considerable amount of organizational and managerial skill can be diverted to this pursuit. A Seed – Fertilizer Voucher Program is an example that provided opportunities for civil servants to earn informal income and the extent various sections of the civil services pursued such opportunities even at the potential disadvantage of the intended beneficiaries.
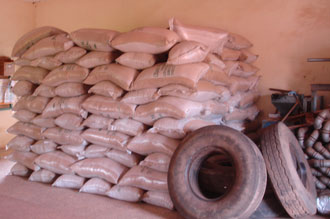
The seed – fertilizer voucher program was designed to provide improved wheat, onion, and seed potatoes plus fertilizer to smallholder farmers throughout all provinces under the basic premise, promoted by the government, that the producers had either consumed their seed or sold it to buy basic subsistence needs, and there was a shortage of useable seed in the smallholder communities. The program was part of the alternative livelihood project aimed at reducing poppy production. It distributed some 500,000 vouchers of mostly wheat seed, but included small amounts seed potato and onion seed. Each voucher contained enough seed for 0.2 ha along with sufficient Urea and DAP fertilizer for the 0.2 ha. The total amount of material purchased and delivered to the districts was some 12,000 MT of wheat seed, 26,000 MT of Urea, 13,000 MT of DAP with lesser amount of onion and seed potato. It had a delivered value exceeding $24,000,000. The program was funded by a consortium of donors and implemented through well established and well known development contractors, on behalf of the government of Ministry of Agriculture, Animal Husbandry, and Food. The national average for a voucher was approximately $40, with a requested repayment value into a development fund of $30. The distribution of the seed and fertilizer was contracted though private wholesale dealers who operated via local private shops as depicted.
-
Read More About: Informal Income Opportunities: Seed – Fertilizer Voucher Program
While it is impossible to determine how much of the government’s imposed adjustments to the program were in pursuit of informal income as compared assuring an appropriate distribution of beneficiaries, or protecting the smallholders from poor quality inputs as proclaimed, the way the adjustments unfolded gave many reasons for concern. This even more a concern considering the time and effort as well as managerial skill that had to be exerted in making the adjustments instead of simply allowing the implementing contractors to proceed with what was a reasonable well conceived distribution plan. Most of the imposed adjustments were done at the provisional and district level. Some of the imposed adjustments were:
- The reallocation of vouchers: Usually the vouchers were planned to be distributed according to the proportion of the smallholder producers in the districts of the different provinces. However, the ministry would often simply insist that they be equally distributed to all districts regardless of the proportion of agriculture production in the districts. If they were informally charging the farmers for the vouchers, this would assure all district extension personnel had an equal opportunity. Other times, the reallocations seemed mostly arbitrary or concentrating around the provincial center leaving the impression it could have been designed to include more family members or friends of the ministry’s staff who would most likely be concentrated near provincial centers. It was accepted that first names on all the beneficiary lists represented family and friends of extension personnel.
- Ordered Vouchers: Vouchers were redeemed in perfect numeric order the probability of which would be virtually impossible if the farmers were distributed the vouchers by extension personnel and redeemed them at the dealer. The implication being they may never have been distributed and simple processed and cashed in.
- A suggestion of repayment in-kind: As mentioned elsewhere in the website in-kind payments are the most common means of repayment for Informal Credit. However, when the voucher in-kind repayment was computed the logic became severely distorted from most deductive reasoning and resulted in a recommended repayment rate of only 1/5th the cash repayment value. Very strange and left one wondering if vouchers were being informally sold and the repayment discounted to cover the informal selling price.
- Quality Complaints on Materials: On several occasions’ complaints about the quality of the seed and fertilizer were filed, even though there were no testing facilities to check the fertilizer content, nor germination facilities for checking seed quality. The implication was the officials needed a substantial gratuity to allow the program to continue. In all cases the seed had come from established seed companies, many of whom were assisted by ICARDA and FAO in getting established in the seed business. The seed quality was also checked by a seed lab operated by FAO. The fertilizer was imported by major fertilizer dealers and represented only 6% of the total fertilizer imports for that growing season. The importers were known to have paid 2.5% the value of the fertilizer in informal customs duties, plus additional informal taxes depending on destination and number of road checkpoints that could encountered. The total informal costs could be as much as 13% of the fertilizer’s value.
- Material Confiscated: On several occasions various government organizations simply confiscated the distribution material. These included a provincial governor, security services and even customs, regardless that the shipments were completely internal or previously cleared imports. All of these appear simply motivated by gratuity opportunities, but in all cases the material was eventually released without payments after considerable effort on the part of the implementing contractors, and at times evoking the presidents office.
The item listed above represent only those activities that required some administrative action on the part of implementing contractors. It did not include others informal income opportunities such as the dealers being obliged to pay gratuities to the senior government officials just for the right to accept the distribution contract in what eventually became a government contract. It was noted that those dealers recommended by the different governors were happy to offer gratuities to the contractor’s staff for the right to the contract. These were turned down and the contract given to other dealers. Also, in some informal discussion some dealers acknowledged that they had to pad their contract to allow sufficient informal payments so the government would not interfere with the distribution.
The net result of all these imposed adjustments to the orderly distribution and redemption of the seed – fertilizer voucher program was the implementing contractors were continuously having to facilitate and adjust the movement of material and accounting of the vouchers. While, as mentioned earlier, it is impossible to accurately determine how much of the above activity was aimed at informal income opportunities it does show the extent to which organizational and administrative skills could be diverted to promoting informal income opportunities. There is ample ground to suspect that much of it is. Also, the diversion of organizational skill to informal income opportunities can be expected to continue as long as civil servant salary scales are such that the hassle to obtain informal income and potential for getting disciplined for doing such is less than the financial need for it.
In the meantime pushing, development projects through government agencies can only result in considerable diversion into informal income opportunities. While nobody wishes to begrudge well educated but poorly paid civil servants a living standard consistent with developed country colleagues, in places where the designated beneficiaries of development assistance clearly see their benefit being diverted or partly diverted to the civil servants, there are several highly undesirable organizations ready to make use of these diversions as recruiting incentives.
In many countries, which experimented with socialism and the government attempting to run the economy, instead of simply facilitating it, deriving informal income from the private sector became highly institutionalized. Frequently, when the government ran the economy and denounced the private sector for exploiting the population, they also quietly relied on the private dealer to overcome the government’s management inefficiencies, and started collecting informal taxes to allow them to operate. The private sector just accepted this as the cost of doing business, and passed it on to the consumers. They were still able to maintain a competitive advantage over most government business entities.
The problem for the donor community is that much of these informal activities are done sufficiently discretely that the donor facilitating team of advisors could be nearly oblivious of their occurrence. However, the intended beneficiaries, who are also the victims, could easily relate the informal activities to the donor funded project with an implied acceptance or even endorsement by the donor or his facilitating team that represents the donor. This could result in projects doing more to inspire anti-donor resentment eventually leading to hostile acts of terrorism, than enhancing the donors national security. Other examples could be Madibira where the irrigation scheme management was emphasizing payments share capital that was independent of the finances of the scheme or even informal payments to obtain a plot of land.